 Web Server Statistics for jabaws/jaba-client-source.jar Web Server Statistics for jabaws/jaba-client-source.jar
(Go To: Top: General Summary: Monthly Report: Weekly Report: Daily Summary: Domain Report: Organisation Report: Host Report: Status Code Report: File Size Report: File Type Report: Directory Report: Request Report)
This report contains overall statistics.
Successful requests: 97
Failed requests: 7
Redirected requests: 2
Distinct files requested: 1
Distinct hosts served: 57
Corrupt logfile lines: 2,670
Unwanted logfile entries: 185,287,242
Data transferred: 6.28 megabytes
Average data transferred per day: 12.61 kilobytes
(Go To: Top: General Summary: Monthly Report: Weekly Report: Daily Summary: Domain Report: Organisation Report: Host Report: Status Code Report: File Size Report: File Type Report: Directory Report: Request Report)
This report lists the activity in each month.
Each unit ( ) represents 1 request.
month: reqs: --------: ----: Nov 2010: 1:Busiest month: Aug 2011 (17 requests).Jan 2011: 7:
Apr 2011: 4:
(Go To: Top: General Summary: Monthly Report: Weekly Report: Daily Summary: Domain Report: Organisation Report: Host Report: Status Code Report: File Size Report: File Type Report: Directory Report: Request Report)
This report lists the activity in each week.
Each unit () represents 1 request.
week beg.: reqs: ---------: ----: 28/Nov/10: 1:Busiest week: week beginning 7/Aug/11 (6 requests).
(Go To: Top: General Summary: Monthly Report: Weekly Report: Daily Summary: Domain Report: Organisation Report: Host Report: Status Code Report: File Size Report: File Type Report: Directory Report: Request Report)
This report lists the total activity for each day of the week, summed over all the weeks in the report.
Each unit () represents 1 request.
day: reqs: ---: ----: Sun: 9:Tue: 20:
(Go To: Top: General Summary: Monthly Report: Weekly Report: Daily Summary: Domain Report: Organisation Report: Host Report: Status Code Report: File Size Report: File Type Report: Directory Report: Request Report)
This report lists the countries of the computers which requested files.
Listing domains, sorted by the amount of traffic.
reqs: %bytes: domain
----: ------: ------
  97:   100%: [unresolved numerical addresses]
(Go To: Top: General Summary: Monthly Report: Weekly Report: Daily Summary: Domain Report: Organisation Report: Host Report: Status Code Report: File Size Report: File Type Report: Directory Report: Request Report)
This report lists the organisations of the computers which requested files.
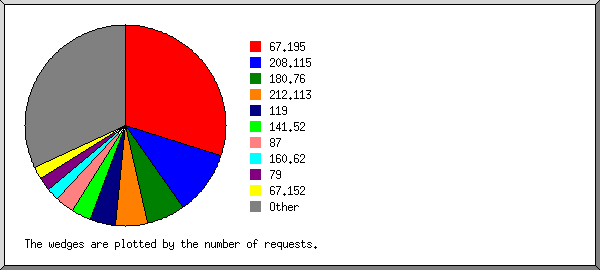
Listing the top 20 organisations by the number of requests, sorted by the number of requests.
reqs: %bytes: organisation
----: ------: ------------
  29: 32.86%: 67.195
  10: 11.33%: 208.115
   6:  6.80%: 180.76
   5:  1.99%: 212.113
   4:  4.53%: 119
   3:  3.40%: 141.52
   3:  3.38%: 87
   2:  2.27%: 160.62
   2:  0.50%: 79
   2:  2.27%: 67.152
   2:  2.27%: 121
   2:  2.27%: 192.31
   2:  2.27%: 88
   1:  1.13%: 65.52
   1:  1.13%: 186.213
   1:  1.13%: 213.186
   1:  1.13%: 50
   1:  1.13%: 38
   1:  1.13%: 93
   1:  1.13%: 198.129
  18: 15.96%: [not listed: 18 organisations]
(Go To: Top: General Summary: Monthly Report: Weekly Report: Daily Summary: Domain Report: Organisation Report: Host Report: Status Code Report: File Size Report: File Type Report: Directory Report: Request Report)
This report lists the computers which requested files.
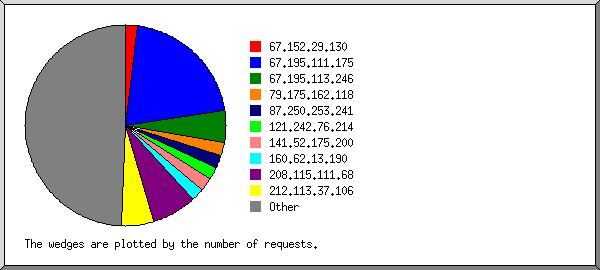
Listing the top 50 hosts by the number of requests, sorted alphabetically.
reqs: %bytes: host
----: ------: ----
   1:  1.13%: 8.11.2.10
   1:  1.13%: 38.99.97.59
   1:  0.25%: 46.4.122.144
   1:  1.13%: 50.19.70.91
   1:  1.13%: 65.52.110.67
   2:  2.27%: 67.152.29.130
  20: 22.66%: 67.195.111.175
   1:  1.13%: 67.195.112.61
   1:  1.13%: 67.195.112.126
   5:  5.66%: 67.195.113.246
   1:  1.13%: 67.195.114.228
   1:  1.13%: 77.200.227.214
   2:  0.50%: 79.175.162.118
   1:  1.13%: 80.187.150.125
   1:  1.13%: 85.17.29.107
   1:  1.13%: 87.177.172.249
   2:  2.25%: 87.250.253.241
   1:  1.13%: 88.69.217.182
   1:  1.13%: 88.217.198.146
   1:  1.13%: 93.2.242.82
   1:  0.87%: 95.108.247.252
   1:  1.13%: 115.119.154.115
   1:  1.13%: 119.63.196.14
   1:  1.13%: 119.63.196.16
   1:  1.13%: 119.63.196.89
   2:  2.27%: 121.242.76.214
   1:  1.13%: 141.52.175.27
   2:  2.27%: 141.52.175.200
   1:  1.13%: 141.84.220.32
   2:  2.27%: 160.62.13.190
   1:  1.13%: 174.37.21.4
   1:       : 176.9.0.119
   1:  0.37%: 178.79.140.240
   1:  1.13%: 180.76.5.49
   1:  1.13%: 180.76.5.110
   1:  1.13%: 180.76.5.113
   1:  1.13%: 180.76.5.137
   1:  1.13%: 180.76.5.183
   1:  1.13%: 186.213.175.148
   1:  1.13%: 192.31.21.150
   1:  1.13%: 193.62.194.247
   1:  1.13%: 198.129.90.176
   7:  7.93%: 208.115.111.68
   2:  2.27%: 208.115.111.242
   1:  1.13%: 208.115.113.83
   1:  1.13%: 209.51.162.219
   1:  1.13%: 210.125.145.151
   5:  1.99%: 212.113.37.106
   1:  1.13%: 213.186.127.17
   1:  1.13%: 218.29.60.105
   7:  6.53%: [not listed: 7 hosts]
(Go To: Top: General Summary: Monthly Report: Weekly Report: Daily Summary: Domain Report: Organisation Report: Host Report: Status Code Report: File Size Report: File Type Report: Directory Report: Request Report)
This report lists the HTTP status codes of all requests.
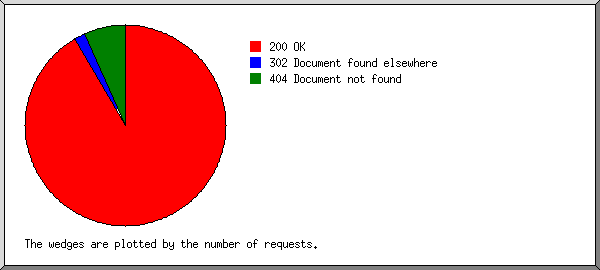
Listing status codes, sorted numerically.
reqs: status code
----: -----------
  97: 200 OK
   2: 302 Document found elsewhere
   7: 404 Document not found
(Go To: Top: General Summary: Monthly Report: Weekly Report: Daily Summary: Domain Report: Organisation Report: Host Report: Status Code Report: File Size Report: File Type Report: Directory Report: Request Report)
This report lists the sizes of files.
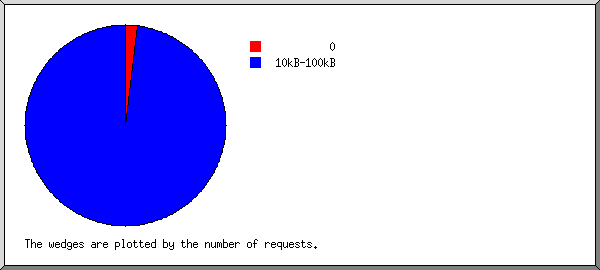
       size: reqs: %bytes:
-----------: ----: ------:
          0:    2:       :
   1B-  10B:    0:       :
  11B- 100B:    0:       :
 101B-  1kB:    0:       :
  1kB- 10kB:    0:       :
 10kB-100kB:   95:   100%:
(Go To: Top: General Summary: Monthly Report: Weekly Report: Daily Summary: Domain Report: Organisation Report: Host Report: Status Code Report: File Size Report: File Type Report: Directory Report: Request Report)
This report lists the extensions of files.
Listing extensions with at least 0.1% of the traffic, sorted by the amount of traffic.
reqs: %bytes: extension
----: ------: ---------
  97:   100%: .jar
(Go To: Top: General Summary: Monthly Report: Weekly Report: Daily Summary: Domain Report: Organisation Report: Host Report: Status Code Report: File Size Report: File Type Report: Directory Report: Request Report)
This report lists the directories from which files were requested. (The figures for each directory include all of its subdirectories.)
Listing directories with at least 0.01% of the traffic, sorted by the amount of traffic.
reqs: %bytes: directory
----: ------: ---------
  97:   100%: /jabaws/
(Go To: Top: General Summary: Monthly Report: Weekly Report: Daily Summary: Domain Report: Organisation Report: Host Report: Status Code Report: File Size Report: File Type Report: Directory Report: Request Report)
This report lists the files on the site.
Listing files with at least 20 requests, sorted by the number of requests.
reqs: %bytes:       last time: file
----: ------: ---------------: ----
  97:   100%: 12/Dec/11 17:46: /jabaws/archive/jaba-client-source.jar
(Go To: Top: General Summary: Monthly Report: Weekly Report: Daily Summary: Domain Report: Organisation Report: Host Report: Status Code Report: File Size Report: File Type Report: Directory Report: Request Report)

