Jalview - Analysis and Manipulation
of Multiple Sequence Alignments
Michele Clamp, James Cuff and Geoff Barton
EMBL-EBI, Hinxton, Cambridge, UK.
Summary
Jalview is a tool written in Java to analyse the residue conservation patterns in a protein multiple alignment as well as being an interactive alignment editor. Unaligned sequences can be aligned either locally or remotely at the EBI with further analysis programs available remotely at the EBI. Access to the database entries for individual sequences is available through SRS. The sequence features can be extracted from the database entries and displayed graphically on the alignment. If three dimensional structures exist for any of the sequences then the structures can be displayed and coloured according to the colour scheme or conservation patterns in the multiple alignment.
Availability:http://circinus.ebi.ac.uk:6543/jalview/ and http://www2.ebi.ac.uk/clustalw
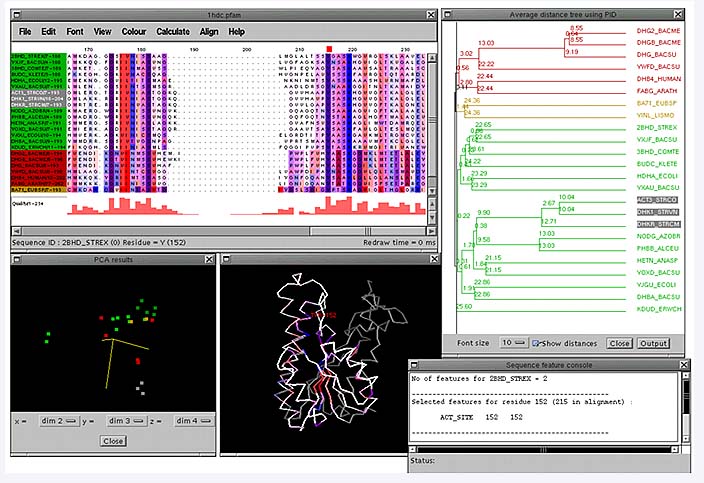
A PFAM [14] alignment of short chain alcohol dehydrogenases which have first been grouped using a dendrogram and then the conserved columns in each group have been coloured according to each residue's hydrophobicity. Underneath are shown the 2nd, 3rd and 4th principal components which is an alternative way of clustering the sequences. The PDB code for the structure was obtained from the feature table of one of the sequences in the alignment and has been coloured according to the conservation patterns in the alignment. This has highlighted the hydrophobic (red) core strands in the structure.
Introduction
A multiple sequence alignment of a protein and its homologues can be a source of information about their common functional and structural features. Identification of these features requires an accurate alignment from which to extract the common features that may be of interest. Even though there are many excellent multiple alignment programs available (e.g. Clustalw [1] and its front end ClustalX [2] and AMPS [3]) there are unfortunately always cases where these automatic methods fail and the alignment has to be changed by hand. Both automatic and manual methods can be used in Jalview to create an alignment. Sequences can be imported into the program and aligned using ClustalW either locally, if Jalview is being run as an application, or remotely via CGI. The automatic alignment can then be altered by hand using the mouse. Patterns of conservation are displayed by varying the colours and the intensities of the residues.
Other multiple sequence alignment editors do already exist such as seaview [12] and CINEMA [13]. In general a disadvantage with these programs is that when manually editing an alignment the user needs to see immediately the results of their edits and whether they change the patterns of conservation. Jalview allows the user to see the effects of their edits. After each edit the user can immediately recluster the sequences and recalculate the pattern of conservation for each alignment. Other external programs for secondary structure prediction can also be called after each edit allowing the user to see how dependent that prediction is on changes to that part of the alignment.
Description of features
Clustering
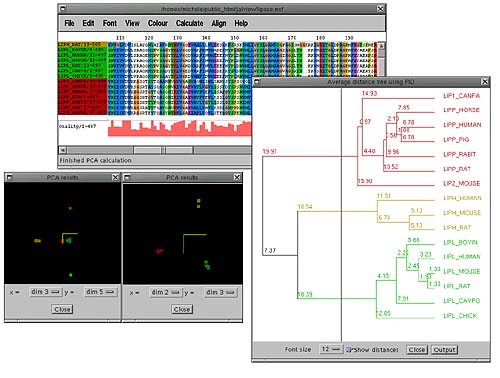
A multiple sequence alignment may consist of a number of subfamilies of sequences that exhibit their own patterns of conservation as well as sharing the common features of the whole alignment. With a large alignment it becomes difficult to spot these subfamilies by eye. Jalview provides two ways of clustering the sequences into subfamilies. A UPGMA dendrogram can be calculated and displayed (Calculate->Average distance tree) either on the whole alignment or on a subset of selected sequences for a large alignment. By selecting a point on the dendrogram with the mouse the maximum distance between any two sequences in a cluster can be defined. The different clusters are then shown in different colours both on the dendrogram and in the main alignment window. In the example below the dendrogram shows there are three obvious subfamilies which have been easily defined by one mouse click.
The other way of grouping sequences in Jalview is by calculating the principal components of the alignment (Calculate->Principal component analysis). This was initially applied to multiple sequence alignments by G. Casari et al and implemented in the program SeqSpace [4]. The PCA window shows 3 of these components at a time in a 3D rotatable view where each axis represents a property of the alignment common to some or all of the sequences. The most informative components to view for clustering sequences are dimensions 2,3 and 4. In the above picture 2 PCA windows are shown. The one on the right shows components 2,3 and 4 which are coloured according to the colours defined in the tree. The window on the left shows components (3,4 and 5) which show a splitting of one of the clusters (in green) showing a subclustering of sequences.
Sequences may also be clustered by hand (Edit->Groups...)
Conservation
Once the sequences have been clustered the patterns of conservation can be calculated and shown for each group. The conservation analysis is based on that in the AMAS program [5] which was itself based on work of Zvelebil et al [6]. Each column in the alignment or group is given a score from 0 to 10 based on the common physico-chemical properties of the residues. The intensity of the colour scheme already present in the alignment is varied according to the score: fully conserved (10) means the most intense colour fading to white for a score of 0. Any colour scheme can be applied before displaying the conservation scores enabling the user to highlight any combination of residues/properties.
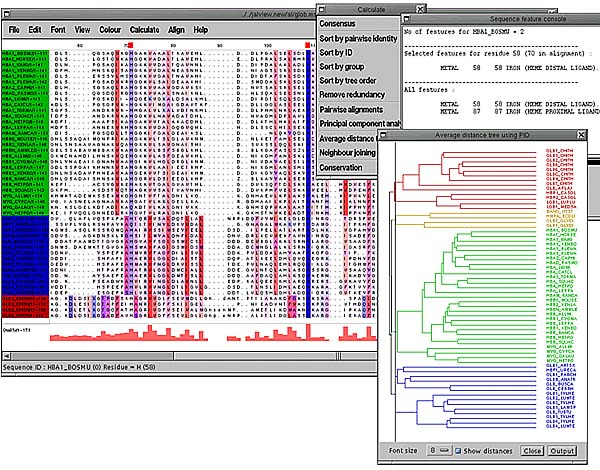
In the example PFAM [14] globin alignment below the sequences have been grouped from a dendrogram into 4 groups. The whole alignment has then been coloured according to the hydrophobicity of the residues (Colour->by hydrophobicity) with red being most hydrophobic and blue being hydrophilic. The conservation of each of the groups has then been calculated (Calculate->Conservation) and the intensities of the columns in each of the groups are automatically varied according to the conservation score. The 2 heme binding groups (in blue) can be seen as well as the characteristic 4 or 5 hydrophobic periodicity of the helices e.g. columns 75,79 and 83 and again in columns 98,102 and 105
Editing
Those hard men (and undoubtedly women) of bioinformatics (HPBs) may eschew any graphical editing of alignments in favour of vi. For us mere mortals having access to the means of quickly recalculating the quality of the alignment and the patterns of conservation within it without having to go through 3 format conversions, a shell script and the vi beep mode is something to be welcomed. Editing in Jalview is done by selecting a residue with the mouse and dragging left and right to insert or delete gaps. If group editing mode is on (Edit->Group editing mode) all sequences in that group are moved together.
It often happens that a multiple sequence alignment which is based on a database search is 'untidy', i.e. it has ragged edges due to unequal lengths of sequences. Jalview provides the ability (as seen in Belvu by Erik Sonnhammer [10]) to trim the alignment left and right to remove these parts of the alignment. Selecting a column in the top scale panel (where the numbers are) will cause a red box to appear above that column. The alignment can now be trimmed either left or right of this column by choosing the appropriate option in the edit menu. Don't choose the wrong one - There is no undo!!
Colour Schemes
There are a number of pre-formatted colour schemes included in Jalview including Willie Taylor's scheme [7], the ClustalX colour scheme [2] and amino acid hydrophobicity. In addition if the Zappo colour scheme is selected (Colour->Zappo) the user can define their own residue colours (Colour->User colour schemes...). Amino acids can be grouped together and have a colour assigned to them. In the example below is a ferredoxin alignment which has had the font size reduced to 4 (Font->Size=4) to give an overview of the alignment and the text switched off (View->Text) to emphasize the colours. The zappo colour scheme has then been changed to colour only the charges and cysteines (in yellow). This shows up an error in the alignment in the 7th column of cysteines where a gap has been put in the wrong place. The quality profile in pink along the bottom also shows a reduced score in this column compared to the other cysteines.
Sequence feature and structure display
When constructing an alignment or just making sense of a database search browsing through the feature tables of the database entries can give extra insights. The database entries for individual sequences can be retrieved by SRS [8] and displayed either in a new browser window or in the Jalview mini-browser if running as an application. To display the sequence features in colour on the alignment choose Colour->View sequence features. If the sequence IDs are the database IDs the features are attached to that sequence and displayed in the main alignment window. Selecting any feature with the mouse will give details about it and the rest of the features attached to that sequence in a separate window.
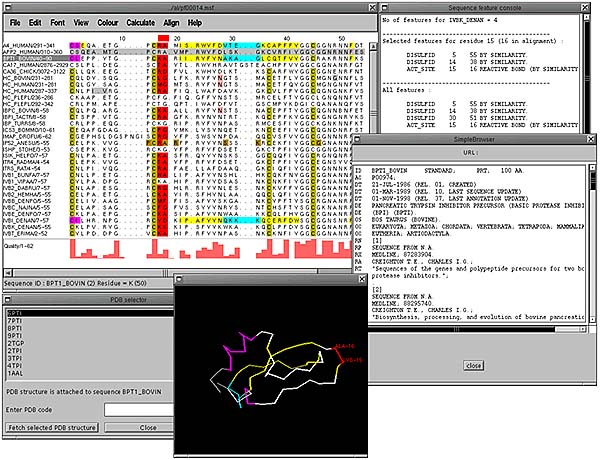
The alignment below shows a PFAM [14] pancreatic inhibitor alignment where the active site is coloured red and the cysteines involved in disuphide bonding are in dark yellow. Sequences that have structural features defined show helices as magenta, sheets as yellow and turns as cyan. In addition, if there are any PDB codes present in the database entry SRS is again used to fetch the 3-dimensional coordinates for that protein, dynamically align it to the sequence and display it in a PDB viewer. The colour scheme present in the alignment is also displayed on the structure.
Analysis on remote servers.
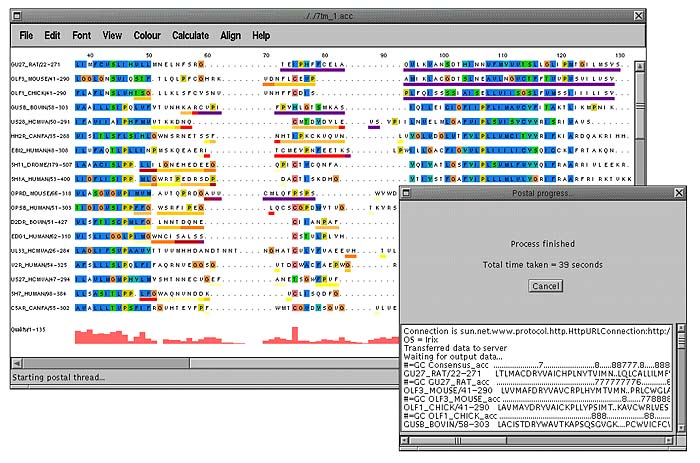
Of course not everything can be done on the client side. Jalview has the ability to run programs either locally (if running as an application) or remotely using CGI. Below is the result of running Ian Holmes' POSTAL [9] application on an alignment which returns a score for each residue according to how probable that each residue is in the correct place in the alignment. The scores are displayed using a colour scheme where ambiguous portions of the alignment have a dark purple colour underneath them and well-defined regions of the alignment have white.
When a remote or local program runs a console window is displayed showing the length of time the program has been running and any output that may have come back from the server/program. Pressing the cancel button will cancel the job
Alignment of blast results
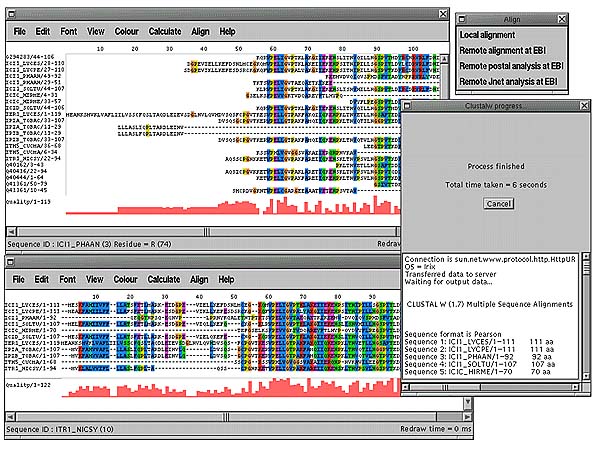
The results of a blast search can often be only fragments of sequences that have a high enough score to the query to be reported. Extracting the full protein sequence and realigning to the query can give a fuller alignment. Jalview can take as input the output of the blast parser MSPcrunch and extract the full sequences from SRS and realign them to the query. The example below shows in the top panel the individual blast1.4 hits to a protein. The alignment has lots of short sequences and the same protein appears more than once in separate lines. The panel underneath shows the result when Jalview has taken the full length sequences and realigned them (using clustalw) to the query sequence. The alignment now has far fewer gaps and similarities to the first portion of the query sequence (residues 1-40) have appeared which weren't apparent before.
Secondary structure prediction
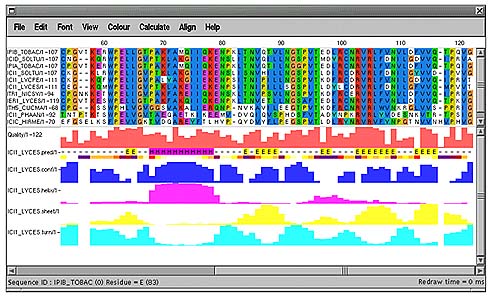
A multiple sequence alignment is often used for predicting the secondary structure of a protein. Jalview is currently used to view the output of Jpred[11], a consensus secondary structure prediction server at the EBI. In addition, a fast neural network prediction method is available on request an experimental server at the EBI written by James Cuff. This is available directly from the Jalview interface and shows Jalview's ability to display the alignment with a prediction and confidence scores for that prediction. In this case the scoring is for secondary structure but the file format accepted (a variant of AMPS [3] BLC format) could contain scores for any property of the alignment. Applications of this kind where the prediction only takes a second or so (as opposed to Jpred) are ideal for interactive alignment editors. The alignment can easily be changed manually and the structure predicted again to see what, if any, differences occur.
References and links.
1. Thompson et al (1994), Nucleic Acids Research, 22, 4673-4680. ftp://ftp.ebi.ac.uk/pub/software/unix/clustalw and ftp://ftp.ebi.ac.uk/pub/software/dos/clustalw
2. Thompson,J.D. et al (1997), Nucleic Acids Research, 24 4876-4882. ftp://ftp-igbmc.u-strasbg.fr/pub/ClustalX/
3. Barton, G. J. (1990), Methods in Enzymology, 183, 403-428.
4. G. Casari, C. Sander and A. Valencia (1995), Nature: Structural Biology 2. http://industry.ebi.ac.uk/Seqspace
5. Livingstone, C. D. and Barton. G. J. (1993), CABIOS 9, 745-756. http://barton.ebi.ac.uk/servers/amas_server.html
6. Zvelebil, M. J. J. M. et al (1987), J. Mol. Biol.,195 957-961.
7. W. Taylor (1997), Protein Engineering 10 743-746.
8. http://srs.ebi.ac.uk
9. I. Holmes and R. Durbin (1998), Journal Computational Biology 5 493-198.http://www.sanger.ac.uk/Users/ihh/postal.html
10. http://www.sanger.ac.uk/Users/esr/Belvu.html
11. Cuff, J.A. et al (1998), Bioinformatics (in press). http://circinus.ebi.ac.uk:8081.
12. N. Galtier, M. Gouy and C. Gautier (1996), CABIOS 12 543-548. \ftp://biom3.univ-lyon1.fr/pub/mol_phylogeny/seaview/
13. T. K. Attwood et al EMBnet.news 3 (3).
http://www.biochem.ucl.ac.uk/bsm/dbbrowser/CINEMA2.1/
14. E. L. Sonnhammer et al (1998), Nucleic Acids Research 26:320-322 http://www.sanger.ac.uk/Software/Pfam
