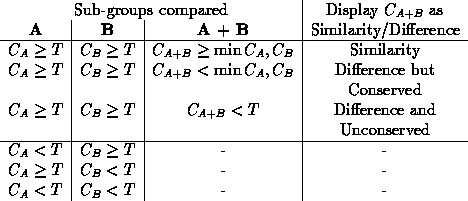


Legend to Table I
Pair comparison of conserved sequence sub-groups. Conservation values
are calculated for the sub-groups and
, and for the sub-groups
combined
. A conservation threshold
is set, similarities
or differences are reported according to the logical operations shown.