


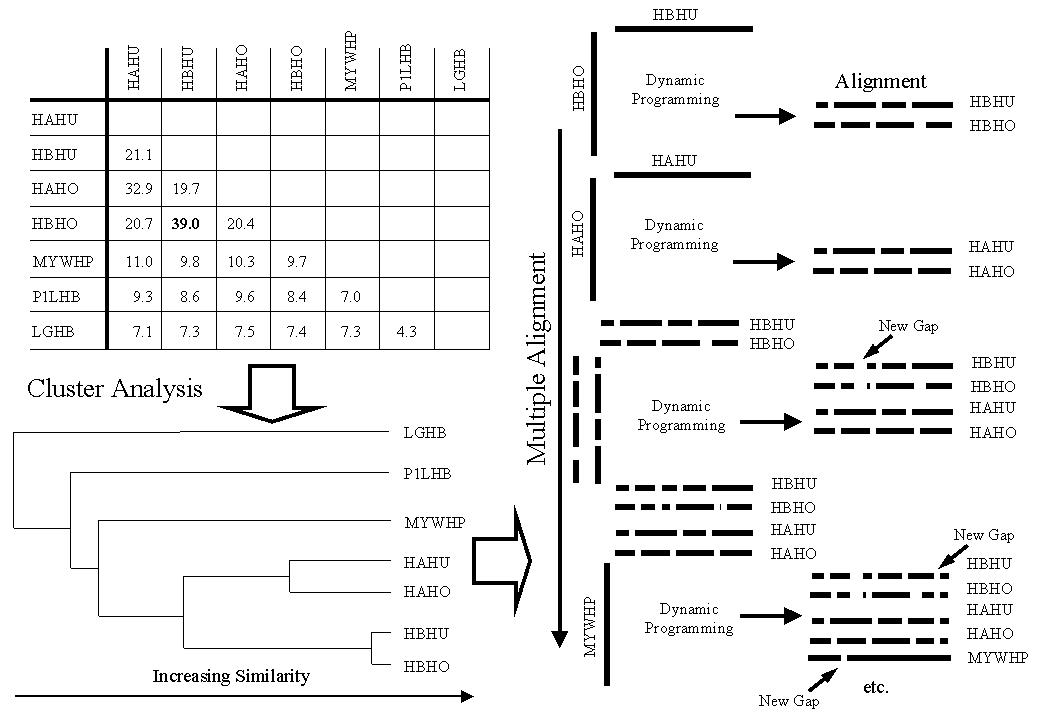
Illustration of the stages in hierarchical multiple alignment of 7 sequences with the identifying codes: HAHU, HBHU, HAHO, HBHO, MYWHP, P1LHB, LGHB. The table at the top left of the Figure shows the pair-wise SD scores for comparison of each sequence pair. Higher numbers mean greater similarity (see text). Hierarchical cluster analysis of the SD score table generates the dendrogram or tree shown at the bottom left of the Figure. Items joined towards the right of the tree are more similar than those linked at the left. Thus, LGHB is the sequence that is least similar to the other sequences in the set, while HBHU and HBHO are the most similar pair. The first four steps in building the multiple alignment are shown on the right of the Figure. The first two steps are pair-wise alignments by dynamic programming (See Section 4.3). The third step is a comparison of profiles from the two alignments generated in steps 1 and 2 (See section 4.5). The fourth step adds a single sequence (MYWHP) to the alignment generated at step 3. Further sequences are added in a similar manner.