
- What is a NoLS?
- Sequence-based search
- Accession-based search
- The predictor
- Explanation of the output
- Command line predictor help
- Virtual Appliance help
- Contacts
|
What is a NoLS?
|
|
|
Sequence-based search
|
|
|
Accession-based search
|
|
|
The predictor
|
|
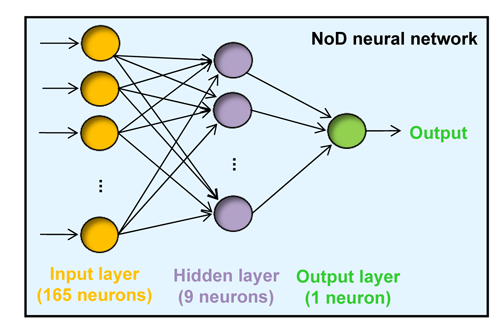 Figure 1 |
|
|
All 13-residue windows of the protein sequence are assigned an output score.
NoLSs are predicted as regions of the protein in which at least 8 consecutive
windows have an average score of at least 0.8.
|
|
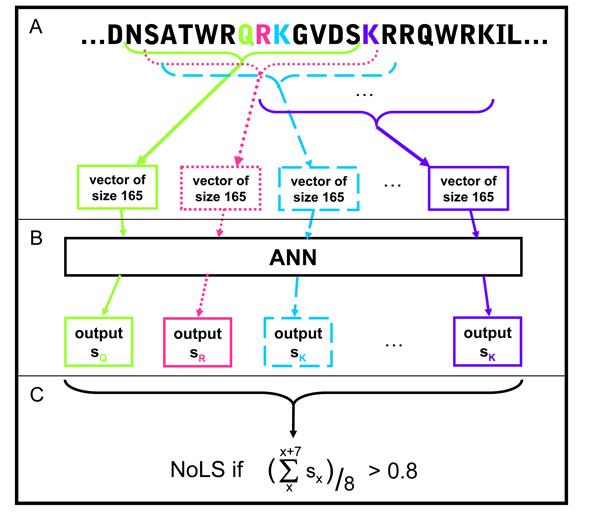 Figure 2 |
|
|
Explanation of the output
|
|
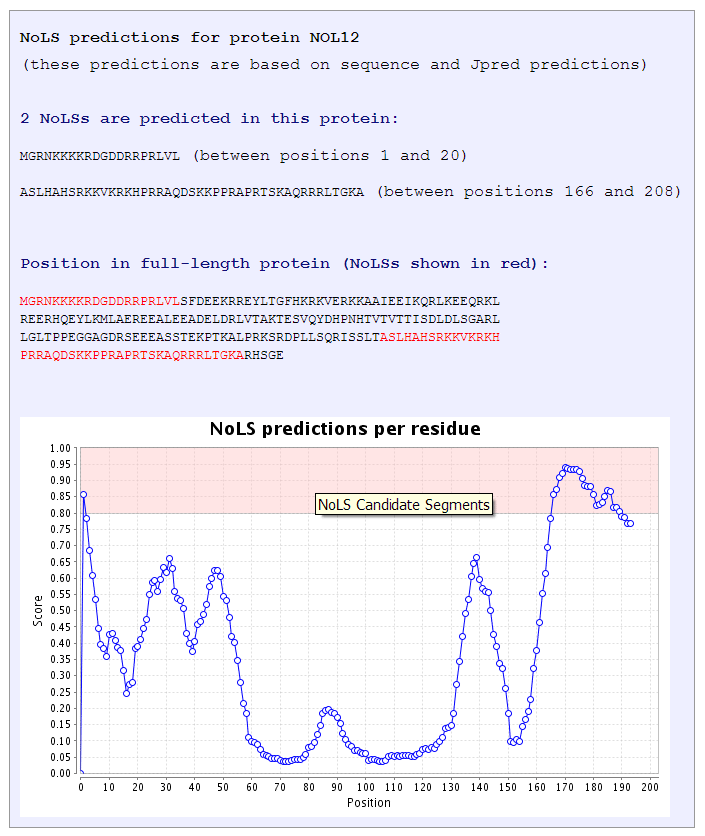 Figure 3 |
|
|
The score shown in the NoLS score per residue graph represents the average score of a segment of 20
residues representing 8 consecutive 13-residue windows (as explained in
The predictor section). This average score is assigned to the first residue
of the 20-mer and thus the graph starts at position 1 of the protein sequence.
|
|
|
Contact Details
If you have any problems or queries with this website, please send an email to |
|